
We aren't limited to just linear and polynomial regression models to fit curves to the data. Let's try utilizing some other functions that we've learned about in math:
The logarithm is a fundamental mathematical function, written as $\log x$. That said, if you haven't learnt to use it yet - no issues. Here's what it looks like:
The logarithmic function doesn't take negative or zero inputs, which is why the graph of the function never crosses the y-axis. In any case, if you see this shape, or something similar (scaled up/down or slightly stretched) in the data, a logarithmic model may be a good idea. If you think you can see the function inverted, that may also be fitted best by a logarithmic model, albeit after you have transformed the data in some way. This maybe a little too complicated, however, and normally shouldn't be required. To produce the result of applying log to some input x in Python, use the function np.log(x).
An exponential function follows this formula:
$$ y=\theta_0+\theta_1e^x $$
Where $e$ is a constant number, known as Euler's Constant. It is roughly 2.72 .
$\theta_0$ would shift the graph up and down, whereas $\theta_1$ would scale the graph vertically. A graph with a positive $\theta_0$ and $\theta_1$ would look something like:
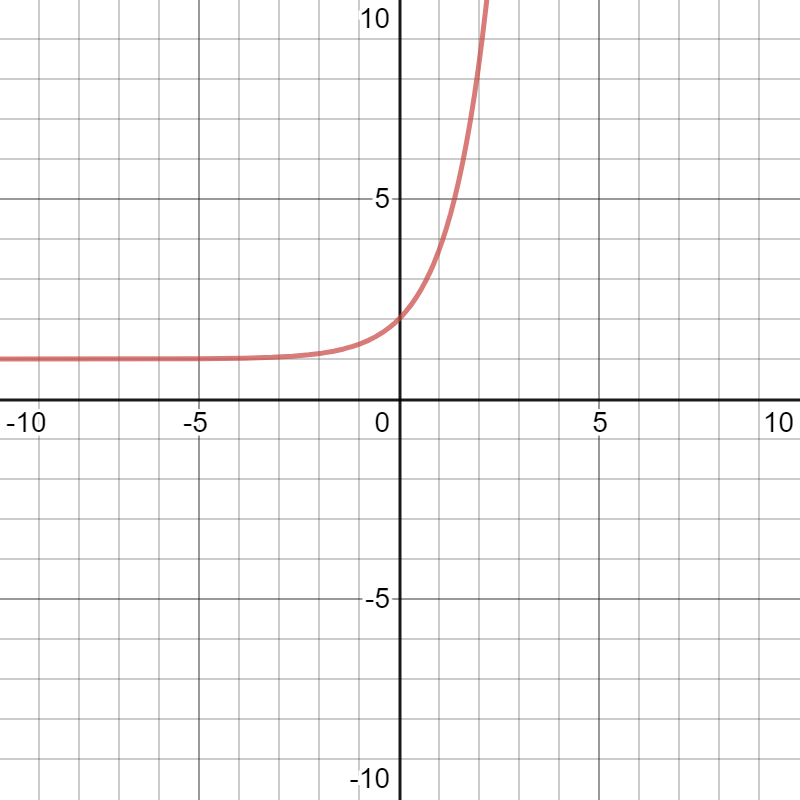
For a negative $\theta_1$, the graph would look like:
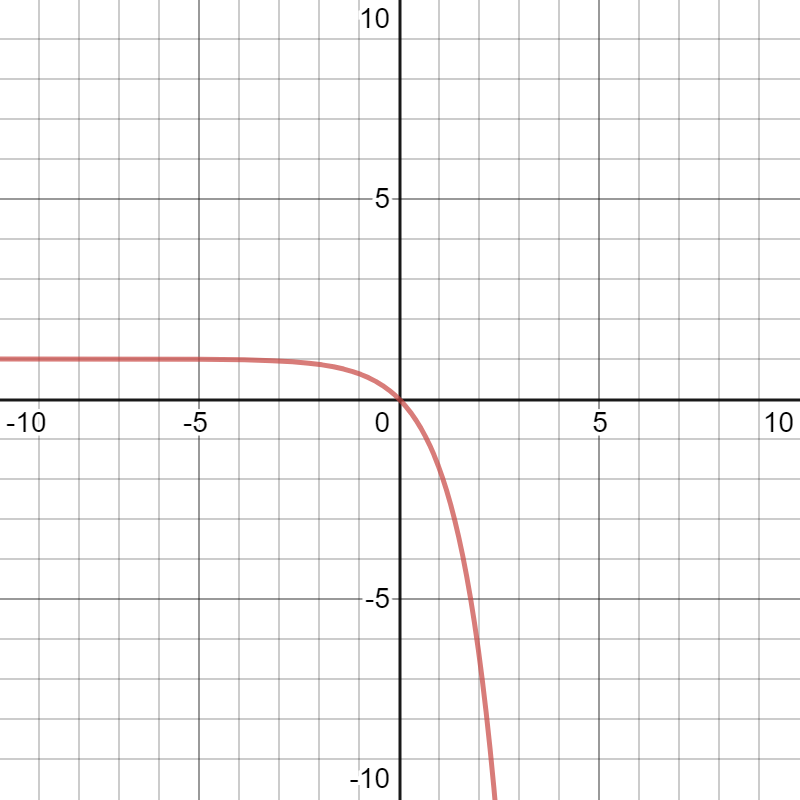
To produce just the $e$ term in Python, usenp.exp(x).
We will implement this practically soon. Try to observe the general shape of these functions, it will help in deciding which kind of model to choose.